Beyond pairwise: finding multivariate correlations in large datasets
Published:
TL;DR. A correlation matrix only tells you about pairs, and some of the most interesting relationships in a dataset only show up when you look at three or more variables together. During my PhD, Koen Minartz, Odysseas Papapetrou and I built Correlation Detective, an exact algorithm that finds these multivariate correlations without enumerating the combinatorial search space, typically an order of magnitude faster than the state of the art and several orders faster than brute force. This post explains the idea in plain words, shows the numbers, and walks through running the library on your own data.
Why pairwise correlation misses things
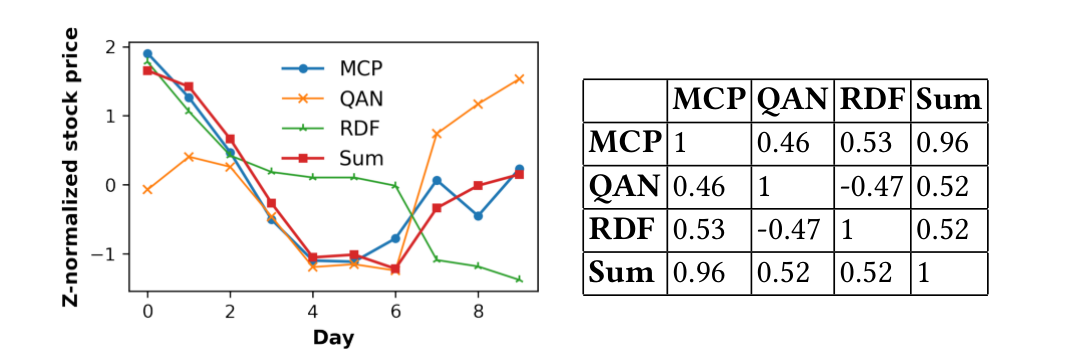
Here is the example that opens our VLDB 2022 paper. Take the daily closing prices of three stocks on the Australian Securities Exchange, MCP, QAN and RDF. Pairwise, none of them look very related: MCP and QAN correlate at 0.46, MCP and RDF at 0.53, and QAN and RDF are negatively correlated at -0.47. But if you add QAN and RDF together, the resulting series tracks MCP with a correlation of 0.96. Looking only at pairs, you would never have found this. The same pattern shows up in fMRI data, where one brain region follows the average activity of two others, and in climate science, where a ternary correlation revealed a new teleconnection pattern.
The two papers cover two families of multivariate correlation measures.
The first is bivariate correlation over aggregates. Take a set of vectors on the left, a set on the right, average each side element-wise, and compute an ordinary two-variable measure between the averages. With Pearson correlation this is often called multiple correlation (the MCP example is exactly this, with one vector on the left and two on the right; “tripoles” are the special case with sets of size 2 and 1). The journal paper also allows Euclidean similarity as the two-variable measure. These are two-sided: the answer says “this group behaves like that group”.
The second is one-sided measures on a single set. The multipole correlation asks how close a set of vectors is to being linearly dependent: one minus the smallest variance of any unit-norm linear combination of them, so it is 1 when some weighted combination is exactly constant. Total correlation is the information-theoretic cousin: the sum of the individual entropies minus the joint entropy, which measures how much redundancy the set contains as a whole. The VLDB 2022 paper handled multiple correlation and multipoles; the VLDB Journal paper generalized the machinery to four measures (Pearson, Euclidean similarity, multipole, total correlation).
Why the search is hard
The problem is purely combinatorial. In a dataset of n vectors, finding all groups of up to p vectors means looking at roughly the sum of binomial coefficients C(n, 2) through C(n, p). With just 100 vectors, checking all ternary correlations already means over 1 million candidates. With 1000 vectors, all quaternary combinations amount to 1 trillion. Just generating that list is a problem, let alone computing a correlation for each entry.
What makes it worse is that apriori-style pruning, where you drop a group as soon as a subgroup fails the test, does not apply. The MCP example shows why: all pairwise correlations were mediocre, and the triple was excellent. Existing algorithms got around this by adding constraints to the definition, hard-coding assumptions about the query, or returning approximate results without guarantees.
How Correlation Detective prunes the space
Bounds instead of exact values. The core observation is that all of these measures can be written as functions of pairwise quantities: pairwise Pearson correlations for multiple correlation and multipoles, dot products for Euclidean similarity, pairwise marginal and conditional entropies for total correlation. So if I know a lower and upper bound on every pairwise correlation between the members of some groups of vectors, I can bound the multivariate correlation of any combination drawn from those groups without computing a single one. For Pearson, the pairwise bounds come from geometry: after z-normalization, correlation is the cosine of the angle between two vectors, and the angle between two cluster centroids plus each cluster’s radius bounds the angle between any two members.
Clustering-based search. Correlation Detective first clusters the vectors hierarchically (top-down K-means++, K around 10, a tree of three to four levels for 1000 vectors). It then enumerates combinations of clusters rather than vectors and computes the bounds for each. If the lower bound is above the threshold, every combination inside is an answer and gets added wholesale. If the upper bound is below it, the whole combination is discarded. Only if the threshold falls in between does the algorithm split the largest cluster and recurse. Because correlated vectors tend to land in the same clusters, most decisions happen high up in the tree, and clustering quality only affects speed, never correctness. Two refinements matter in practice: using the actual minimum and maximum pairwise correlations between cluster members instead of the worst-case geometric bounds narrows them by 50 to 90 percent and cuts runtime by about an order of magnitude, and a top-k variant seeds the running threshold with the k-th highest pairwise correlation and prioritizes promising branches. The same prioritization gives a progressive mode that returned around 80 percent of the answers in 10 percent of the time in the 2022 experiments, and over 90 percent in the journal experiments.
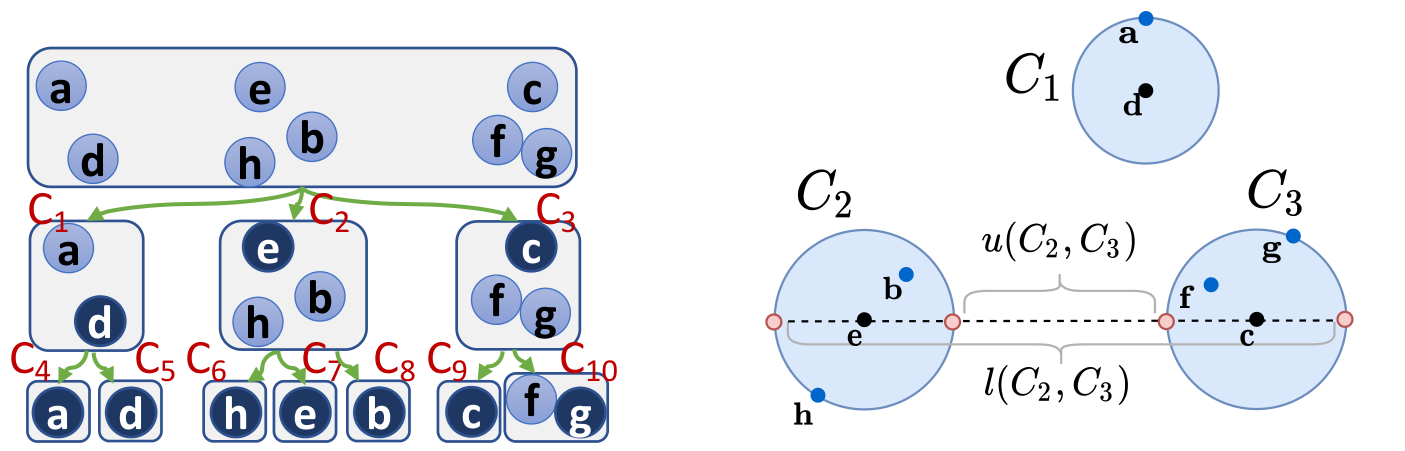
Keeping results fresh on streams. The bounds of a cluster combination depend on only two pairs of vectors per cluster pair: the ones that determine the minimum and maximum pairwise correlation (the “extrema pairs”). CDStream stores every decisive cluster combination in an index keyed by those pairs. When a new value arrives, the index says which extrema pairs might have changed; if they are still valid, nothing else needs checking. Updates are processed in batches (in the journal version, configurable epochs inside a sliding window, trading freshness for throughput). Because a burst of updates can invalidate so much of the index that recomputing from scratch is cheaper, CDHybrid fits a small online regression on arrival counts and execution times and switches between CDStream and plain CD automatically.
Results
Thresholds and query patterns differ per row, so read across, not down.
| Dataset | Size | Baseline | What happened |
|---|---|---|---|
| fMRI (VLDB 2022) | 9,700 series x 5,470 obs. | CONTRa (tripoles, min. jump 0.1) | CONTRa did not finish in 24 h; CD took 17,027 s for the same results at threshold 0, and 458 s at threshold 0.9 |
| SLP (VLDB 2022) | 171 series x 108 obs. | CoMEtExtended (multipole, size 4) | CoMEtExtended one to two (rho=0) or two to three (rho=0.02) orders of magnitude slower than CD, and returned fewer results |
| fMRI (VLDB 2022) | subsets up to 9,700 series | Exhaustive search | Several orders of magnitude; exhaustive runs interrupted after 20 h |
| fMRI (VLDBJ) | 237 and 509 series | Four in-memory DBMS, SQL for PC(1,3) | CD 2.70 s and 16.63 s; DBMS1 168.86 s and 5,138.61 s; the other three timed out at 8 h |
| Stocks (VLDBJ) | subsets up to 12,800 of 28,678 stocks | Two exhaustive baselines (OPT, UNOPT) | Baselines hit the 8 h limit for all four measures; CD’s runtime grows at a much slower rate |
| Stocks stream (VLDB 2022) | 1,000 stocks, window 2,000 | CD re-run per batch | CDStream needs a few milliseconds per batch for small patterns, about an order of magnitude less than CD |
Running Correlation Detective
The library is Java 11+, GPL-3.0, at github.com/CorrelationDetective/library. It implements the static algorithm; the streaming code is in the research repository. Install via Maven:
<dependency>
    <groupId>io.github.correlationdetective</groupId>
    <artifactId>CorrelationDetective</artifactId>
    <version>1.0</version>
</dependency>
or build from source:
git clone https://github.com/CorrelationDetective/library.git
cd library
mvn clean install
Input is a CSV in row-major (first row holds vector names, first column dimension names) or column-major order. A threshold query for the stock example’s pattern, one vector on the left and up to two on the right:
String inputPath = "/path/to/your/dataset.csv";
SimEnum simMetricName = SimEnum.PEARSON_CORRELATION; // also MULTIPOLE, TOTAL_CORRELATION, EUCLIDEAN_SIMILARITY, ...
int maxPLeft = 1;
int maxPRight = 2;

CorrelationDetective cd = new CorrelationDetective(inputPath, simMetricName, maxPLeft, maxPRight);
cd.runParameters.setQueryType(QueryTypeEnum.THRESHOLD); // default is TOPK with topK = 100
cd.runParameters.setTau(0.7);

ResultSet rs = cd.run();
List<ResultTuple> resultTuples = rs.getResultTuples();
rs.saveAsCSV("/path/to/output/results.csv");

StatBag statBag = cd.getStatBag();
statBag.saveAsJson("/path/to/output/stats.json");
Other useful knobs in RunParameters are setMinJump, setIrreducibility, setTopK, and setNVectors to try a prefix of the data first; PARAMETERS.md in the repository lists all of them. The parameter table also lists SPEARMAN_CORRELATION and MANHATTAN_SIMILARITY, which are not evaluated in the papers.
What I would use it for today
- Atmospheric and climate data. In my current work on downscaling atmospheric simulations, I look at hundreds of gridded variables at once. Asking which combinations of two or three upstream variables jointly track a target quantity is exactly a PC(1,2) query.
- Finding baskets in financial data. An asset that tracks a combination of others is interesting for hedging and for spotting redundancy in a portfolio. The streaming variant is what you want to keep up with minute-level prices.
- Monitoring many sensors or servers. Prior work used multivariate correlation across server requests to detect denial-of-service attacks. Any setting with thousands of streams where a single sensor is only explained by a combination of others fits.
The Correlation Detective website has more of these scenarios, from fMRI and genomics to flash trading and weather sensor networks, plus a two-minute video introduction and an interactive demo of CDStream on NYSE trade and quote data.
Links
- Paper page: Multivariate correlations discovery in static and streaming data (VLDB 2022, open PDF)
- Paper page: Efficient detection of multivariate correlations with different correlation measures (The VLDB Journal, 2024, open access)
- Project website: correlationdetective.com, with a video introduction, an interactive demo and more application scenarios
- Library and docs: GitHub
- Talk: VLDB 2022 presentation in Sydney, with slides and the recording
Cite this
@article{minartz2022multivariate,
  author  = {Minartz, Koen and d'Hondt, Jens E. and Papapetrou, Odysseas},
  title   = {Multivariate Correlations Discovery in Static and Streaming Data},
  journal = {Proceedings of the VLDB Endowment},
  volume  = {15},
  number  = {6},
  pages   = {1266--1278},
  year    = {2022},
  doi     = {10.14778/3514061.3514072}
}

@article{dhondt2024efficient,
  author  = {d'Hondt, Jens E. and Minartz, Koen and Papapetrou, Odysseas},
  title   = {Efficient detection of multivariate correlations with different correlation measures},
  journal = {The VLDB Journal},
  volume  = {33},
  pages   = {481--505},
  year    = {2024},
  doi     = {10.1007/s00778-023-00815-y}
}